Getting Started
This page contains useful tips to install and run the app.
Make sure that your environment is correctly set up to execute Python code and that your pip and Python are up-to-date.
The app has been successfully tested with Python versions equal or higher to 3.9.13.
Installation
Clone the repo
git clone https://github.com/bis-med-it/SDMX-dashboard-generator.git
(Recommended) Create virtual environment using
virtualenvpython.exe -m pip install --upgrade pip pip install virtualenv cd SDMX-dashboard-generator/ virtualenv venv --system-site-packages .\venv\Scripts\activate
or if you use
virtualenvwrapperpython.exe -m pip install --upgrade pip pip install virtualenvwrapper cd SDMX-dashboard-generator/ mkvirtualenv SDMX-dashboard-generator workon SDMX-dashboard-generator
Install dependencies
python.exe -m pip install --upgrade pip
cd SDMX-dashboard-generator
pip install -r requirements.txt
If you wish to contribute, you can install the optional development requirements:
pip install -r requirements/dev_requirements.txt
From the root folder, run the app
python app.pyOpen your browser at http://127.0.0.1:5000 if you use Flask or http://127.0.0.1:8050
How To With Examples
Use The Sample Yaml Files
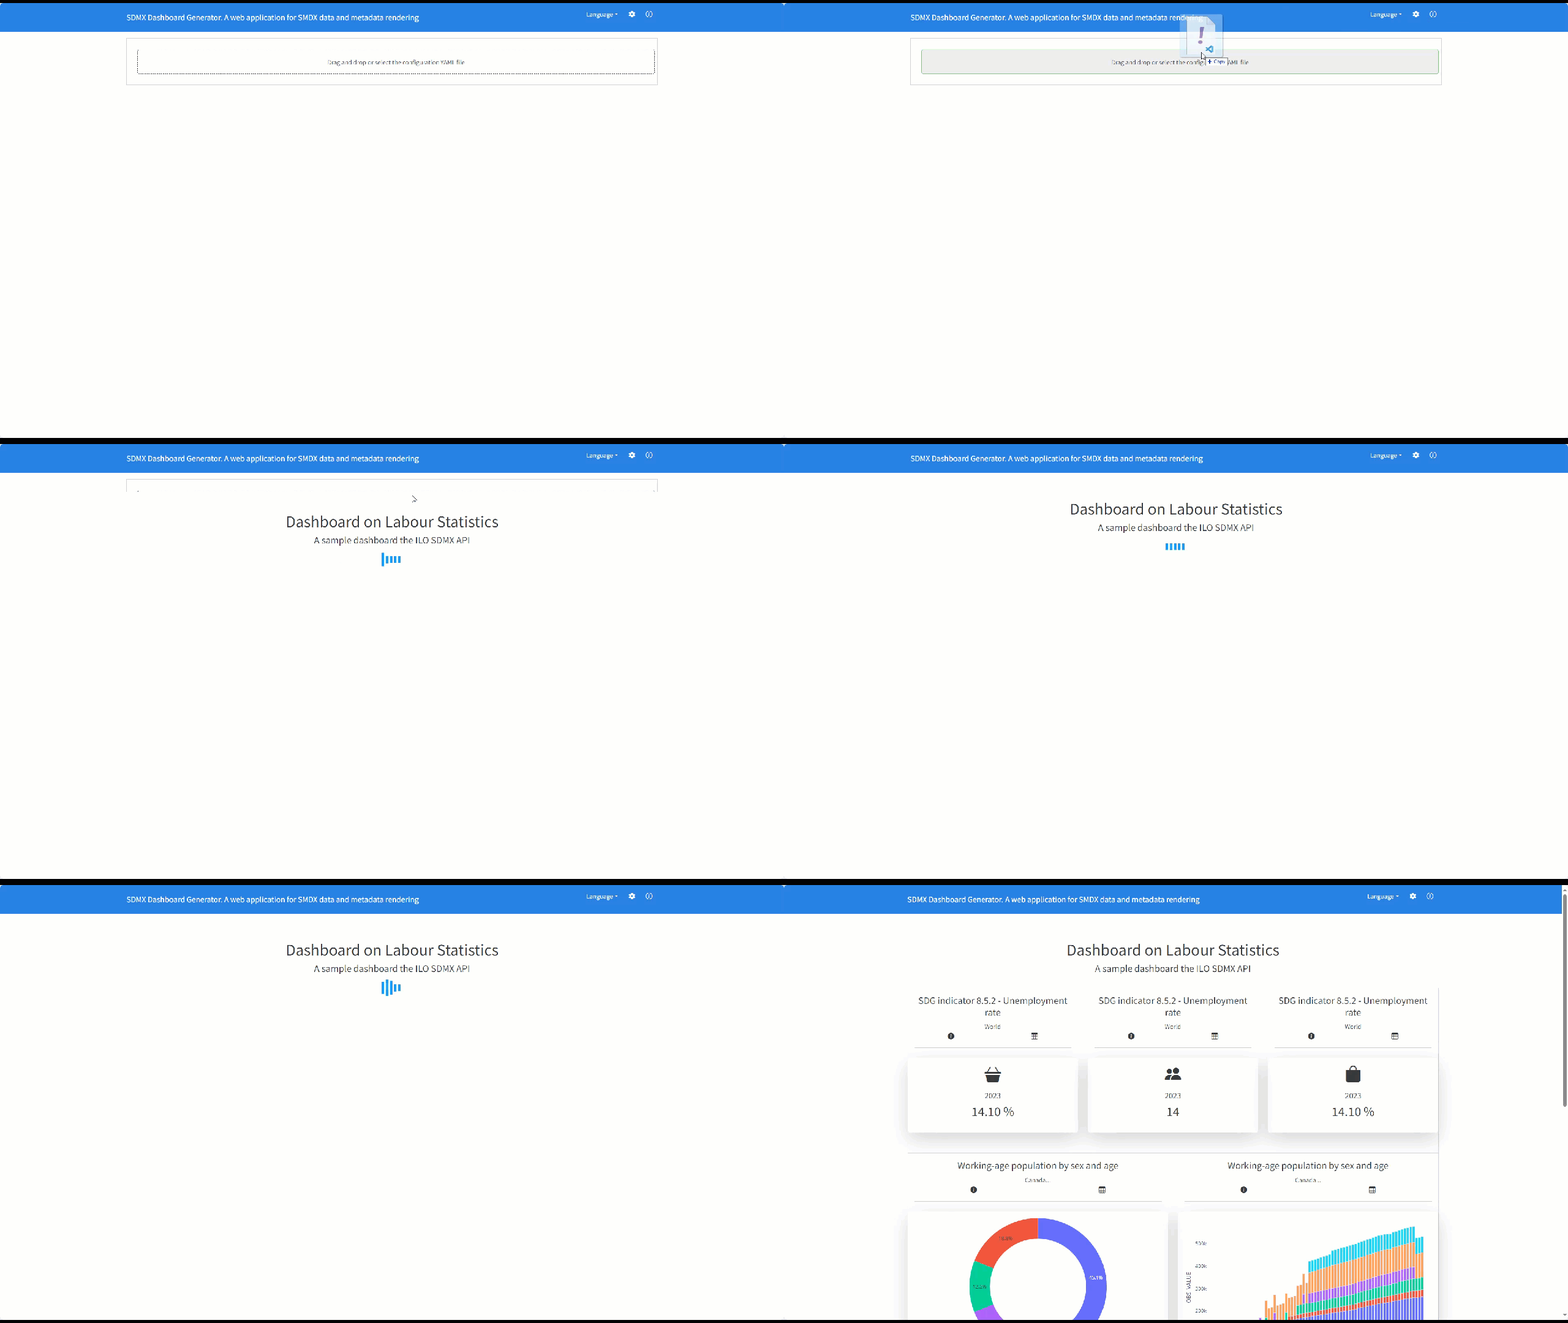
To start with, you may use the sample Yaml files stored in the /yaml folder. For example, just navigate to the ILO dashboard by navigating http://127.0.0.1:5000/ilo or http://127.0.0.1:8050/ilo if you use Flask. You can also test the BIS dashboard by adding /bis to your Dash url.
Upload The Yaml File
The application comes with examples stored in the /yaml folder which can be used in two ways:
by uploading one
.yamlfile in the interface via drag and drop or

by typing the
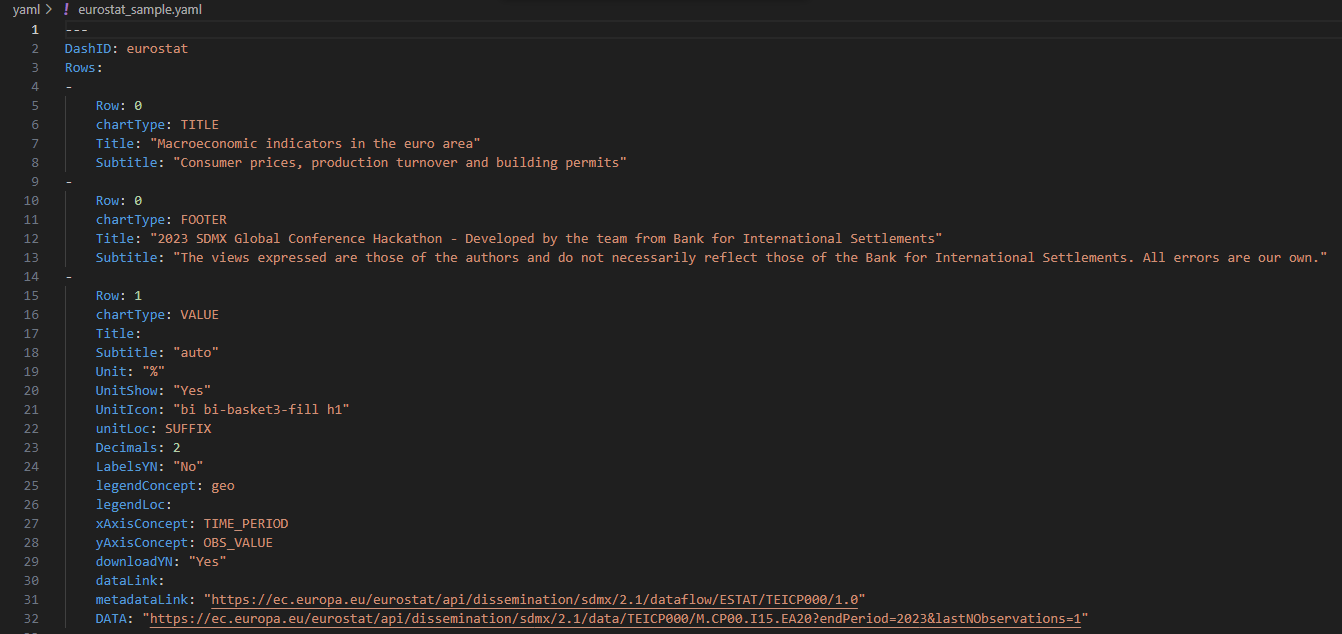
DashIDof the dashboard in the URL (i.e. http://127.0.0.1:5000/eurostat for theeurostat_sample.yamlfile which containsDashID: eurostat)

The application will scan the existing content in the yaml subfolder of the project and load the .yaml file containing the requested DashID. If none is found, the app will raise a PreventUpdate.
Example Of Yaml File Settings
Example of .yaml structure (the elements need to follow the indicated order to pass the validation test):

DashID: dashboard identifier using any string composed of numbers, letters, and underscores, which can be used to compose the URL to display the dashboard. For example, if the base URL of the application ishttp://127.0.0.1:5000and theDashIDiseurostat, the dashboard might be displayed at http://127.0.0.1:5000/eurostatRow: row position of the visual indicated as an integer value 0…3. Up to three charts can share the same row and they are distributed left-right in the order they appear in the specification file. Title, subtitle and footnotes are identified withRow=0andchartType=TITLEandchartType=FOOTERrespectivelyTitle: title description of the chart. If no title is specified, the dashboard shows automatically the name of the requested dataflow, supported by multilingual translationSubtitle: a string to complement the title description of the chart. Ifautois provided, the subtitle takes the code name fromlegendConcept. If more than one code name is available, then it will take the first one and append to it.... If the subtitle node is empty, no subtitle will be shownUnit: a string to describe the unit which can be shown in the chart ifUnitShowis set toYesUnitIcon: a bootstrap icon to be shown on top of the KPI. Full list available at: https://icons.getbootstrap.com/Decimals: the number of decimalschartType: it can be KPI (i.e. VALUE) or charts (i.e. PIE, LINE and BAR)legendConcept: indicates the dimension that defines multiple series to be displayed in the visualization (e.g. sectors of the pie chart, each of the lines in a lines chart or each cluster in a bar chart)legendloc: indicates the legend location which can be TOP, BOTTOM, LEFT, RIGHT or HIDE for no legend. Not applicable to the KPILabelsYN: indicates (“Yes”/”No”) whether the description of each category is to be displayed on the chart. Not applicable to the KPIxAxisConcept: indicates the concept to be allocated on the x-axis (e.g. TIME_PERIOD for LINES)yAxisConcept: indicates the concept to be allocated to the y-axis (e.g. OBS_VALUE)downloadYN: indicates (“Yes”/”No”) whether the download of the data behind the chartdsdLink: an URL of an application or file containing related the datastructure datametadataLink: an URL of an application or file containing reference metadata (e.g. used in the info button). This is field is mandatory ifdsdLinkis providedDATA: an URL of an application or file containing data.